|
|
使用 scikit-learn 與 Python
例子:
- import matplotlib.pyplot as plt
- from sklearn.datasets import make_blobs
- from sklearn.cluster import KMeans
- # 隨機產生 10 組 2 features 的資料 500 筆 (dy 即原始目標值 label 0~9)
- dx, dy = make_blobs(n_samples=500, n_features=2, centers=10, random_state=42)
- # 用 KMeans 在資料中找出 5 個分組
- kmeans = KMeans(n_clusters=5)
- kmeans.fit(dx)
- # 預測新的目標值 label
- new_dy = kmeans.predict(dx)
- plt.rcParams['font.size'] = 14
- plt.figure(figsize=(16, 8))
- # 以不同顏色畫出原始的 10 群資料
- plt.subplot(121)
- plt.title('Original data (10 groups)')
- plt.scatter(dx.T[0], dx.T[1], c=dy, cmap=plt.cm.Set1)
- # 根據重新分成的 5 組來畫出資料
- plt.subplot(122)
- plt.title('KMeans=5 groups')
- plt.scatter(dx.T[0], dx.T[1], c=new_dy, cmap=plt.cm.Set1)
- # 顯示圖表
- plt.tight_layout()
- plt.show()
KMeans 非監督式 機器學習 演算法 Python
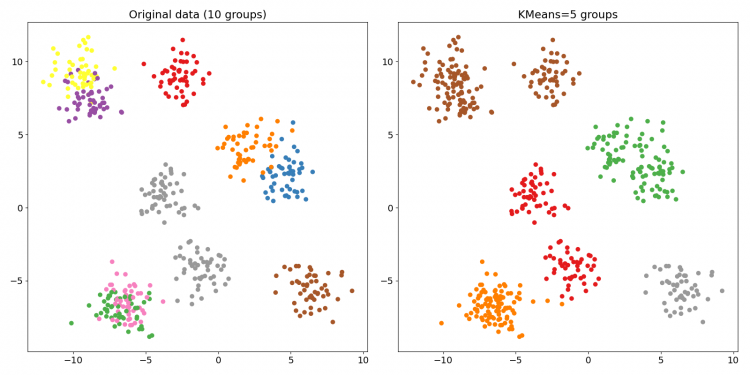
藉由顏色的識別,很容易看出資料從 10 組變成 5 組了。也就是說,你可以用 new_dy 取代原本的目標值 dy,等於是簡化了標籤數量。
上面之所以只有 2 個 features(即 2 個自變數),是因為這樣才能畫成二維圖表。增加到 3 個可畫成三維,來挑戰一下:
- import matplotlib.pyplot as plt
- from mpl_toolkits.mplot3d import Axes3D # matplotlib 3.2.0 後可省略
- from sklearn.datasets import make_blobs
- from sklearn.cluster import KMeans
- dx, dy = make_blobs(n_samples=500, n_features=3, centers=10, random_state=42)
- kmeans = KMeans(n_clusters=5)
- kmeans.fit(dx)
- new_dy = kmeans.predict(dx)
- plt.rcParams['font.size'] = 14
- fig = plt.figure(figsize=(16, 8))
- ax = fig.add_subplot(121, projection='3d')
- plt.title('Original data (10 groups)')
- ax.scatter(dx.T[0], dx.T[1], dx.T[2], c=dy, cmap=plt.cm.Set1)
- ax = fig.add_subplot(122, projection='3d')
- plt.title('KMeans=5 groups')
- ax.scatter(dx.T[0], dx.T[1], dx.T[2], c=new_dy, cmap=plt.cm.Set1)
- plt.show()
KMeans 非監督式 機器學習 演算法 Python
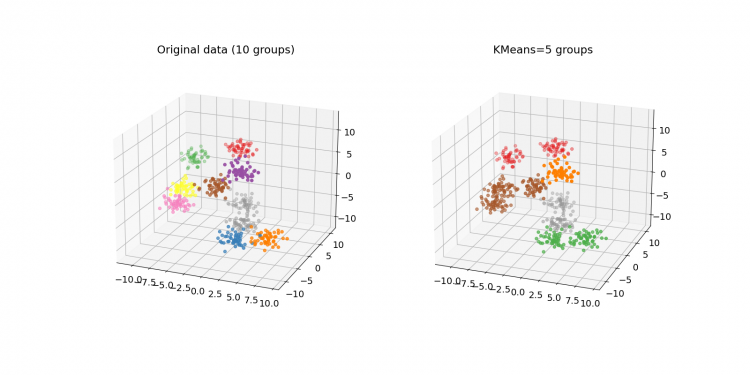
但 K 值要指定為多少才是合適的呢?說什麼非監督式學習,結果還不是要自己一個個試啊?特別是 make_blobs() 每次產生的資料還不一樣呢,一重新執行資料就跑掉了(除非你加上 random_state 參數來固定它)。
決定最佳 K 值的方式有幾種,scikit-learn 能做的有手肘法(看誤差平方和)和看側影係數。手肘法讓人有點無所適從,用側影係數比較簡單,找最大的值就行了。但這邊還是把兩者一併畫出來:
- import matplotlib.pyplot as plt
- from sklearn.datasets import make_blobs
- from sklearn.metrics import silhouette_score
- from sklearn.cluster import KMeans
- colors = ['red', 'orange', 'yellow', 'green', 'cyan',
- 'blue', 'purple', 'brown', 'grey', 'black']
- # 產生的資料組數 (10)
- clusters = 10
- # K 值的範圍 (2~10)
- k_range = range(2, clusters + 1)
- dx, dy = make_blobs(n_samples=500, n_features=2, centers=clusters, random_state=42)
- distortions = []
- scores = []
- # 記錄每種 K 值建出的 KMeans 模型的成效
- for i in k_range:
- kmeans = KMeans(n_clusters=i).fit(dx)
- distortions.append(kmeans.inertia_) # 誤差平方和 (SSE)
- scores.append(silhouette_score(dx, kmeans.predict(dx))) # 側影係數
- # 找出最大的側影係數來決定 K 值
- selected_K = scores.index(max(scores)) + 2
- # 重新建立 KMeans 模型並預測目標值
- kmeans = KMeans(n_clusters=selected_K).fit(dx)
- new_dy = kmeans.predict(dx)
- # 新分組的資料中心點
- centers = kmeans.cluster_centers_
- plt.rcParams['font.size'] = 12
- plt.figure(figsize=(12, 12))
- # 原始資料分組
- plt.subplot(221)
- plt.title(f'Original data ({clusters} groups)')
- plt.scatter(dx.T[0], dx.T[1], c=dy, cmap=plt.cm.Set1)
- # 新資料分組
- plt.subplot(222)
- plt.title(f'KMeans={selected_K} groups')
- plt.scatter(dx.T[0], dx.T[1], c=new_dy, cmap=plt.cm.Set3)
- plt.scatter(centers.T[0], centers.T[1], marker='^', color='orange')
- for i in range(centers.shape[0]): # 標上各分組中心點
- plt.text(centers.T[0][i], centers.T[1][i], str(i + 1),
- fontdict={'color': 'red', 'weight': 'bold', 'size': 24})
- # 繪製誤差平方和圖 (手肘法)
- plt.subplot(223)
- plt.title('SSE (elbow method)')
- plt.plot(k_range, distortions)
- plt.plot(selected_K, distortions[selected_K - 2], 'go') # 最佳解
- # 繪製係數圖
- plt.subplot(224)
- plt.title('Silhouette score')
- plt.plot(k_range, scores)
- plt.plot(selected_K, scores[selected_K - 2], 'go') # 最佳解
- plt.tight_layout()
- plt.show()
KMeans 非監督式 機器學習 演算法 Python
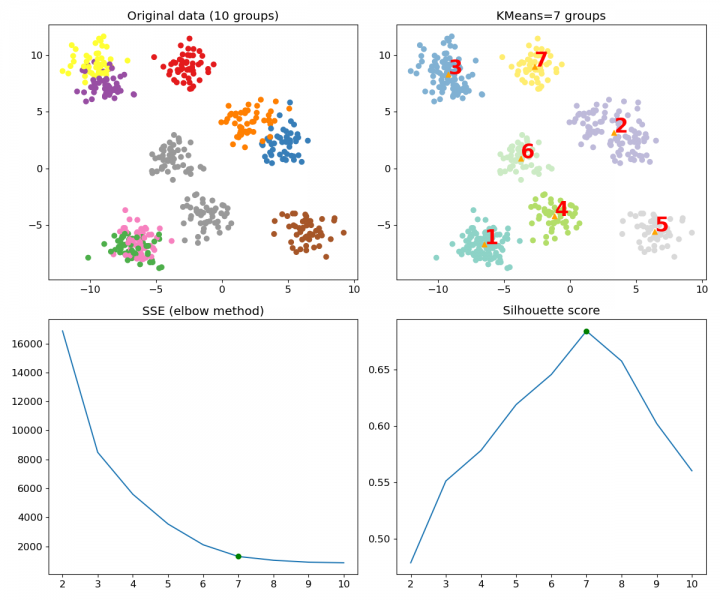
從上排的圖,可以看到資料自動從 10 組分成最佳的 7 組,比之前的 5 組合適多了,並標示出 KMeans 找到的各個中心點(來自 cluster_centers_)。下排的圖一邊是手肘法,另一邊是側影係數,兩者都在最佳 K 值處標上一個點。
當然,這邊我們在 make_blobs() 加入 random_state 參數,好確保每次產生的結果一致。你可以試著把這參數拿掉再重新執行程式,實際的 K 值和分組也會有所改變。這樣一來實際上會分成幾組,就看各組隨機資料彼此重疊的程度有多大。
那麼,KMeans 到底能怎麼套用在真實資料呢?考慮到 raw data 難尋,我們來嘗試對已經用到爛的波士頓房價資料集(原本是用來跑迴歸模型)做分析看看:
- import matplotlib.pyplot as plt
- import seaborn as sns
- import pandas as pd
- from sklearn import datasets
- from sklearn.metrics import silhouette_score
- from sklearn.cluster import KMeans
- data = datasets.load_boston()
- # 把波士頓房價的 data 和 target 合併成一個 pandas DataFrame
- dx = pd.DataFrame(data['data'], columns=data['feature_names'])
- dy = pd.DataFrame(data['target'], columns=['MEDV'])
- df = pd.concat((dy, dx), axis=1)
- # 最大 K 值
- K_max = 20
- # 計算側影係數
- scores = []
- for i in range(2, K_max + 1):
- scores.append(
- silhouette_score(
- df, KMeans(n_clusters=i).fit_predict(df)))
- # 得出最佳 K 值
- selected_K = scores.index(max(scores)) + 2
- print('K =', selected_K, '\n')
- # 對房價分組
- kmeans = KMeans(n_clusters=selected_K)
- labels = kmeans.fit_predict(df)
- # 將分組資料 (分類標籤) 併入原資料
- lb = pd.DataFrame(labels, columns=['labels'])
- df = pd.concat((lb, df), axis=1)
- # 印出標籤和房價、以及其統計結果
- print(df[['labels', 'MEDV']], '\n')
- print('原始資料\n', df['MEDV'].describe(), '\n')
- # 抽出不同組的房價並印出統計結果
- df_group = []
- for i in range(selected_K):
- df_new = df[df['labels']==i]['MEDV']
- print(f'分類 {i + 1}\n', df_new.describe(), '\n')
- df_group.append(df_new)
- # 用 seaborn 畫出所有組別房價的箱型圖
- sns.boxplot(data=df_group)
- plt.show()
輸出結果:
K = 3
labels MEDV
0 1 24.0
1 1 21.6
2 1 34.7
3 1 33.4
4 1 36.2
.. ... ...
501 1 22.4
502 1 20.6
503 1 23.9
504 1 22.0
505 1 11.9
[506 rows x 2 columns]
原始資料
count 506.000000
mean 22.532806
std 9.197104
min 5.000000
25% 17.025000
50% 21.200000
75% 25.000000
max 50.000000
Name: MEDV, dtype: float64
分類 1
count 366.000000
mean 24.931694
std 8.334857
min 11.800000
25% 19.500000
50% 22.800000
75% 28.575000
max 50.000000
Name: MEDV, dtype: float64
分類 2
count 102.000000
mean 17.429412
std 9.184539
min 5.000000
25% 12.150000
50% 15.300000
75% 20.600000
max 50.000000
Name: MEDV, dtype: float64
分類 3
count 38.000000
mean 13.126316
std 4.395310
min 7.000000
25% 9.750000
50% 13.250000
75% 14.975000
max 27.500000
Name: MEDV, dtype: float64 KMeans 非監督式 機器學習 演算法 Python
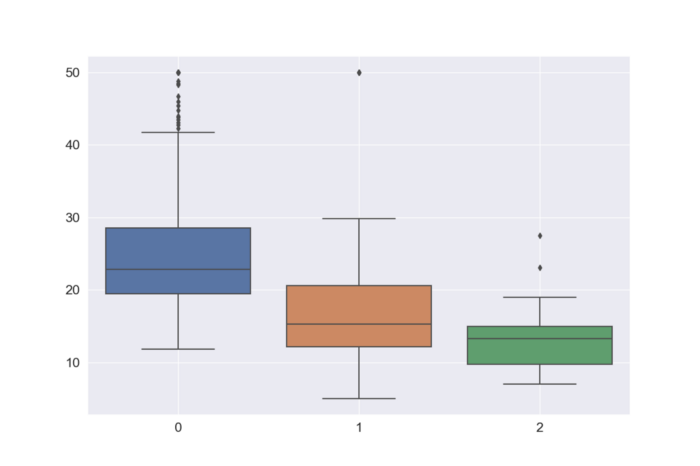
這裡 KMeans 把波士頓資料集分成了三組(就算把 K 上限設到 500 也一樣得到 K = 3),等於是加上了新的標籤。上面我們將這三組的房價拆開來看,可以發現每組的平均跟標準差都不同。當然,你程式跑出來這三組的統計數據可能會稍微有點差距就是。
這也許意味著,該資料集內的不動產依其居住條件(?)可大致劃分成三類。也許進一步分析資料集內的其他變數,會有更有趣的發現吧。
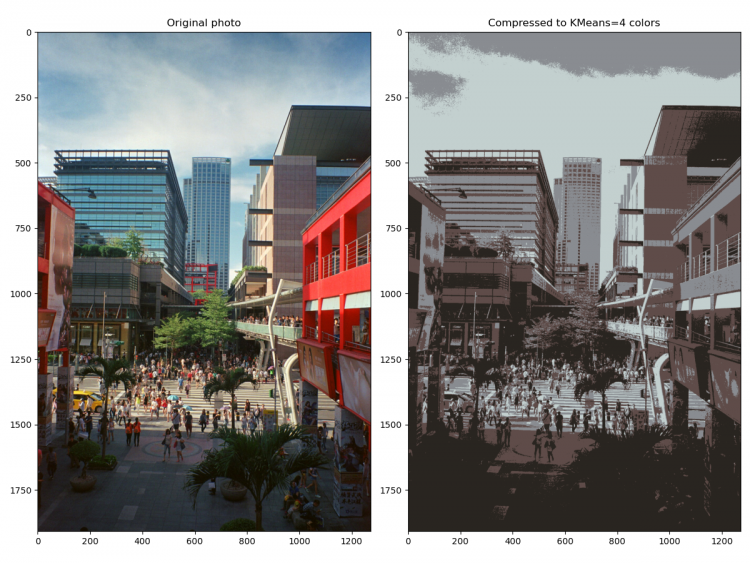
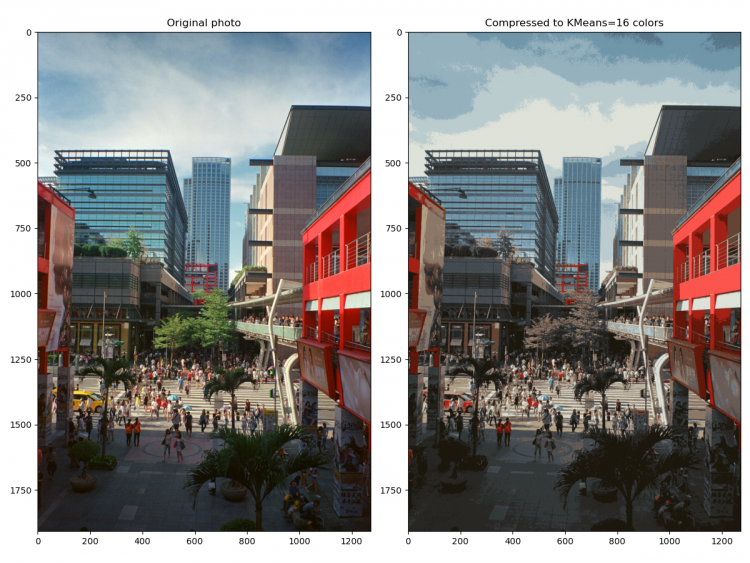
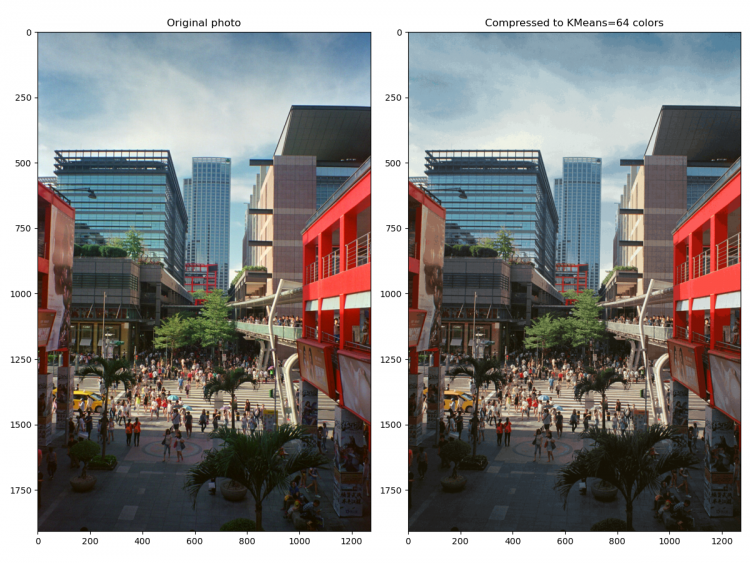
另一個常介紹的 KMeans 應用,便是圖片壓縮。更精確地說,是利用 KMeans 來減少顏色數量、進而達到減少圖片儲存空間的效果。
Photo by Simone Hutsch on Unsplash
下面的程式會從電腦載入一張照片(小編本人拍的照片,台北信義區,不算大的底片掃描檔,1272 x 1908),然後將它壓縮成只有 K 種顏色的圖片。
- import numpy as np
- import matplotlib.pyplot as plt # 需安裝 pillow 才能讀 JPEG
- from matplotlib import image
- from sklearn.cluster import MiniBatchKMeans
- # K 值 (要保留的顏色數量)
- K = 64
- # 讀取圖片
- image = image.imread(r'C:\Users\使用者名稱\Downloads\photo.jpg') / 255
- w, h, d = tuple(image.shape)
- image_data = np.reshape(image, (w * h, d))
- # 將顏色分類為 K 種
- kmeans = MiniBatchKMeans(n_clusters=K, batch_size=5000)
- labels = kmeans.fit_predict(image_data)
- centers = kmeans.cluster_centers_
- # 根據分類將顏色寫入新的影像陣列
- image_compressed = np.zeros(image.shape)
- label_idx = 0
- for i in range(w):
- for j in range(h):
- image_compressed[i][j] = centers[labels[label_idx]]
- label_idx += 1
- # 如果想儲存壓縮後的圖片, 將下面這句註解拿掉
- #plt.imsave(r'C:\Users\使用者名稱\Downloads\compressed.jpg', image_compressed)
- # 顯示原圖跟壓縮圖的對照
- plt.figure(figsize=(12, 9))
- plt.subplot(121)
- plt.title('Original photo')
- plt.imshow(image)
- plt.subplot(122)
- plt.title(f'Compressed to KMeans={K} colors')
- plt.imshow(image_compressed)
- plt.tight_layout()
- plt.show()
在此,KMeans 從所有色彩(每個像素就有 256 x 256 x 256 種可能性)找出 K 種顏色,這時 cluster_centers_ 記錄的就是這 K 種顏色的紅綠藍組合。於是,只要根據新的標籤把分組過的顏色寫進新影像陣列,就能得到「壓縮過」的圖片了。
當然由於把整個照片讀進程式,電腦記憶體會爆掉,所以這邊改用 MiniBatchKMeans 來對像素「抽樣」。MiniBatchKMeans 跑得比 KMeans 快,但尋找中心點的效果也就會差一點。
下面來試試不同的 K 值,比較一下壓縮效果:
KMeans 非監督式 機器學習 演算法 Python
KMeans 非監督式 機器學習 演算法 Python
KMeans 非監督式 機器學習 演算法 Python
文章出處
|
|